How to Create a Colorful Pie Chart Design in Photoshop
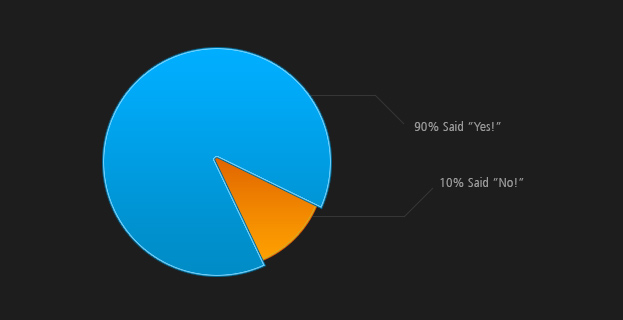
Want to show some data with the help of a pie chart but not sure how to create one? This tutorial will show you how to create a colorful pie chart inside Photoshop.
01. Open a new document and fill it with any color to create a background. Now create a new layer at Layer > New > Layer, select the Round Marquee tool and create a circle. Fill that circle also with any color but be sure it is created on a new layer.
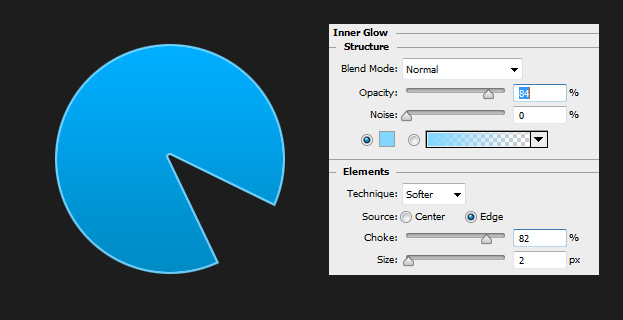
02. Now take the Polygonal lasso tool and make a triangle selection on a part of the circle and hit delete to cut it. The size of the cut-out depends of the data.
03. Now go to Layer > Layer Style > Gradient Overlay (or Color Overlay) and set the color for your chart. Then, in the same window, move to Inner Glow tab and add a lighter color of sharp glow around the shape. Don’t press Ok yet.
04. Now move to the Stroke tab and add a darker stroke around the shape. Press Ok.
05. Now create another new layer and drag in under your first chart layer. Again, create a circle (this time under) and fill it with any color.
06. Again, move to Layer > Layer Style > Gradient overlay and this time choose different color for your new chart. Also add the inner shadow and darker stroke. Press Ok.
07. Take the Line tool and draw some lines from the charts.
08. Take the Type tool and insert your text at the ends of the lines.
09. And your pie chart is ready to show some info!


